Helsinki Digital Humanities Hackathon 2018
Tags: reflections June 06, 2018
I stereotype most of the hackathons as a weekend event for computer nerds, where technology companies are pushing their newly released products to be tested or to seek innovative usecases. Typically, such hackathons end up being cheap labour for the companies where they get their work done quickly from the participants who are there for the sake of “free pizzas and beers”, or at most, for the glory of winning a hoodie. Recently, I attended the fourth edition of Helsinki Digital Humanities Hackathon (#DHH18) which was interestingly different from most of the other hackathons I have attended so far.
1. What is it all about?
This one week (23/05/18 - 01/06/18) hackathon in the University of Helsinki brought together students and researchers of humanities, social sciences and computer science under the same hood of digital humanities. As per their definition, Digital humanities is “applying modern data processing to solve research questions in the humanities and social sciences”. But, to most of the participants, it was more of a networking event while working on multidisciplinary research project.
Yes! There was no competition to win prizes. Instead, a pure enthusiasm to learn something new was clearly evident.
There were five themes ( = teams) working on different interesting societal topics which would be complicated without computational automation as follows :
- People in the News - exploring the newsworthiness of people found in National Library of Finland’s newspaper corpus.
- Russia Finland - to find how these two countries portray each other in their news media.
- Early Modern Publishing - interpreting the developments publication practices, genres, and roles of publishers from the 18th century.
- The Death Psalm of Bishop Henry - extracting historical contents from multiple versions of orally transmitted literature Lalli who killed the Bishop Henry as per the legends.
- Helsinki in Geotagged Social Media - utilizing the social media as a source of data for understanding Helsinki in terms of its cultural diversity.
May be because of my experience with social media as a social media addict ( i.e. partially forced due to societal norms), I was chosen to be in the Helsinki in Geotagged Social Media (GeoSoMe) team.
Our awesome geosome team was as below:
- Firaz, an architect turned humanitarian
- Saara, the linguist
- Anton and Lulia, the two young hackers from ITMO university of Russia
- Primary mentor: Asst. Prof. Tuomo Hippala, an expert in multimodal communication along with many other things.
- Prof. Tuuli Toivonen (geoinformatics) was the other mentor.
- Simon and Elias to assist us with the servers and geoinformatics tools respectively.
2. What we had and what was our idea?
On the first day of the hackathon, Dr. Tuomo gave an introductory presentation about the research that he is doing along with Tuuli in the Digital Geography Lab. We had the option to work on one or more of the following datasets:
| Dataset | # Records | # Users | Temporal extent | Spatial extent |
|---|---|---|---|---|
|
Flickr |
126017 |
2701 |
01/01/14 - 07/10/17 |
Helsinki Region |
|
|
1316705 |
207329 |
01/06/14 - 31/03/16 |
Helsinki Region |
|
|
61338 |
9260 |
17/02/16 - 02/03/18 |
Helsinki Municipality Region |
Table 1: Dataset available to the GeoSoMe team at #DHH18
During the first three days of preparation, our team decided to work on the Instagram dataset, simply because it was the largest dataset we had and it was interesting. Also, we wanted to perform some sentiment analysis of all aspects the Instagram post - captions, hashtags and emojis (and if time permits, the images as well), to see what areas of Helsinki metropolitan region is the happiest. We even boldly presented our plan for the hackathon as “Happiness in social media” at the end of the preparation phase (first three days). Here is how our data looked if we simply plotted on a map without any processing:
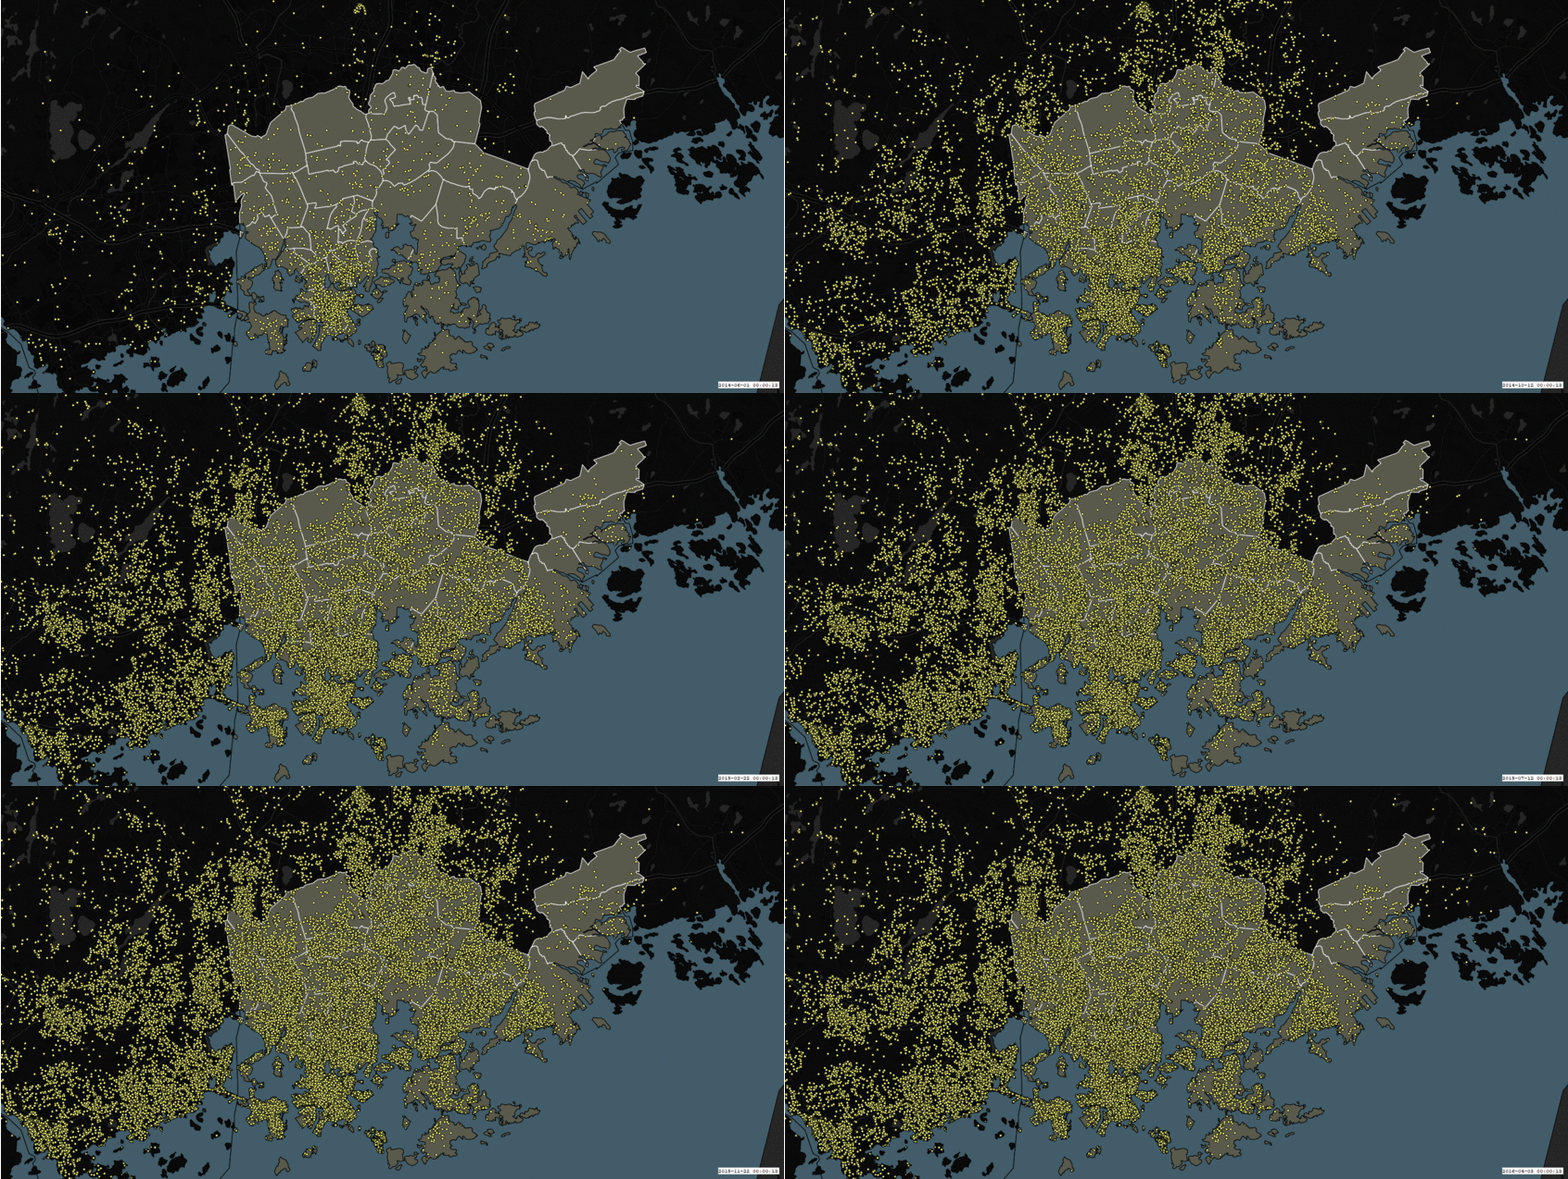
Figure 1: Instagram dataset on a map: Growth of Instagram posts over time
Over the next couple of days, we figured out that defining happiness and quantifying it over social media is not a low hanging fruit. Especially because when there is the happiness bias, i.e. everyone pretends to be positive over social media as happy people, whatever results that we can produce in one week would be misleading. Furthermore, sentiment analysis to computers is just positive (+ve), negative (-ve) or neutral (0), whereas in reality the whole notion of human sentiments or emotions stretches over at least eight dimensions such as love, optimism, submission, awe, disapproval, remorse, contempt and aggressiveness. So, eventually (to be honest, after the midway presentation) we narrowed down from over-enthusiastic “happiness” to a more realistic research questions on sentiments as following two explorations:
- Spatial: How sentiment polarity is distributed in the neighborhoods of Helsinki?
- Temporal: What is the variation of sentiments over time?
My role: Being one of the three team members who can code, I took responsibilities of cleaning the data, followed by running language detection algorithms, and doing some traditional natural language processing tasks before delivering it to be plotted on a map.
3. Preprocessing
While most of the other teams had clear objectives, ours was quite vague. However, the actual problem was to deal with the messy data that was inherently cluttered, multilingual, and contain contents (text, emojis, hashtags) that could be completely random and not necessarily compliment each other.
Since core of our idea was to perform sentiment analysis, we used the following preprocessing strategies:
- Remove all posts with no good text content by dropping posts with no texts or contains just emojis and hashtags.
- Restrict the posts that are only in English, because sentiment analysis for texts in languages other than English yields no good results at all.
- Filter the posts that are in Helsinki metropolitan region only. In other words, remove every post that was geotagged within Espoo or Vaanta region.
The first task was very simple. As I learned, removing posts with no text by dropping posts with no text can be done in two-liner code when loading the data into Pandas dataframe as follows:
df = pd.read_csv("instagram.tsv", na_values=['', ' ', '\N'], sep="\t")
 df = df.applymap(lambda x: np.nan if isinstance(x, basestring) and x.isspace() else x)
Basically, convert caption cells with empty spaces to Nan values with na_values argument of pandas.read_csv() function and then drop them.
Now for the language detection, the available Python libraries were langdetect, langid, NLTK and fastText. We chose fastText, because it had pre-trained language identification models for 176 languages; it was fast and reliable. As the state-of-the-art library by Facebook Research, it was suitable for dealing with multilingual social media platforms like Instagram.
It is very common for people to use multiple languages while posting on social media. However, we wanted posts that are genuinely in English. So, using fastText we firsttagged each posts with a language to represent is as a language diversity treemap. We omitted all those posts that were tagged with multiple languages, and retained the English posted which has a confidence score of more than 70%.
Then to restrict the posts within Helsinki metropolitan region, we applied [custom neighborhoods polygon map of Helsinki] and left all other points outside it. To divide Helsinki into discernible units, we could have also relied on Postcode division, Square grids or Land use division criteria.
At this point, we had reduced 1,316,705 Instagram posts from our initial dataset to 193,111 posts that are in English and within “Helsinki”.
3. Sentiment analysis
Now comes the heart of our idea - the sentiment analysis. I have previous done sentiment analysis of Tweets and it was not so difficult. Hence, I obviously assumed that doing the same for Instagram would not be a big deal. Surprisingly, it was not the case!
Even though Twitter users use hashtags, they seemed more disciplined than the users of Instagram. Instagram users tend to use hashtags as an integrated part of their sentences, however, many of them were random or associated with an event or global trend. Also, over use of Internet slangs was an overkill for over analysis. Nonetheless, we (thanks to Saara) created a manually annotated goal standard for the polarity of sentiments for about 50 Instagram posts, and verified it against two sentiment analysis libraries.
Using Vader we performed sentiment analysis of the ‘text-only’ part of the caption that is without emojis and hashtags. This is actually where figured out that there is an excessive use of integrated hashtags in any given caption text. So, we then used Aylien API to analyze the whole caption as it is. We checked the results against the our goal standard, and the comparison is shown in Figure 2.
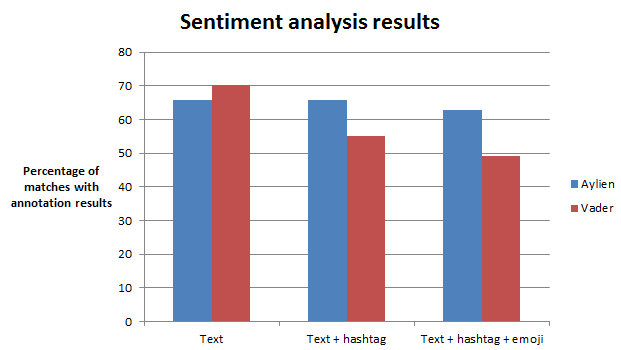
Figure 2: Efficiency of sentiment analysis APIs (VADER vs Aylien) with manually annotated goal standard
In spite of the high accuracy for ‘text-only’ sentiment analysis, due to its factual correctness we decided to use Aylien (which was comparatively more accurate than Vader) for sentiment analysis text+emoji+hashtags of the caption. To get best out of the results, we filtered by setting the threshold of polarity confidence to 0.7.
Meanwhile, I created a treemap of emoji usage with a simple regex script as follows:
emoji_count = defaultdict(int)
for i in df['text']:
    for emoji in re.findall(u'[\U0001f300-\U0001f650]|[\u2000-\u3000]', i):
        emoji_count[emoji] += 1

for k,v in sorted(emoji_count.items(), key=lambda(k,v): v, reverse=True):
	print "{},{}".format(k.encode('utf-8'),v)
At this point, we have a refined dataset which contains posts that are in English, within Helsinki and tagged with sentiment polarity with confidence of at least 70%.
4. Results
As the last step, we used QGIS, a FOSS geographic information system (GIS) application, to put our results on a map. With Elias’s help Firaz did most of the work related to QGIS (including the flashy gif shown in figure 1). Here are the end product “Sentiments in Helsinki - Spatiotemporal Analysis of Instagram Posts”.
Figure 3 shows the number of people posting on Instagram from each sub-region of Helsinki metropolitan area. Not so surprisingly, most posts are geotagged to the touristic part of Helsinki city center (around Kamppi and Rautatieasema). This bias is also due to the fact that Instagram picks location coordinated from the “Facebook’s tagged location” and not necessarily from the actual coordinates. Also, it is usual for people to tag to “Helsinki” for anything that is happening around.
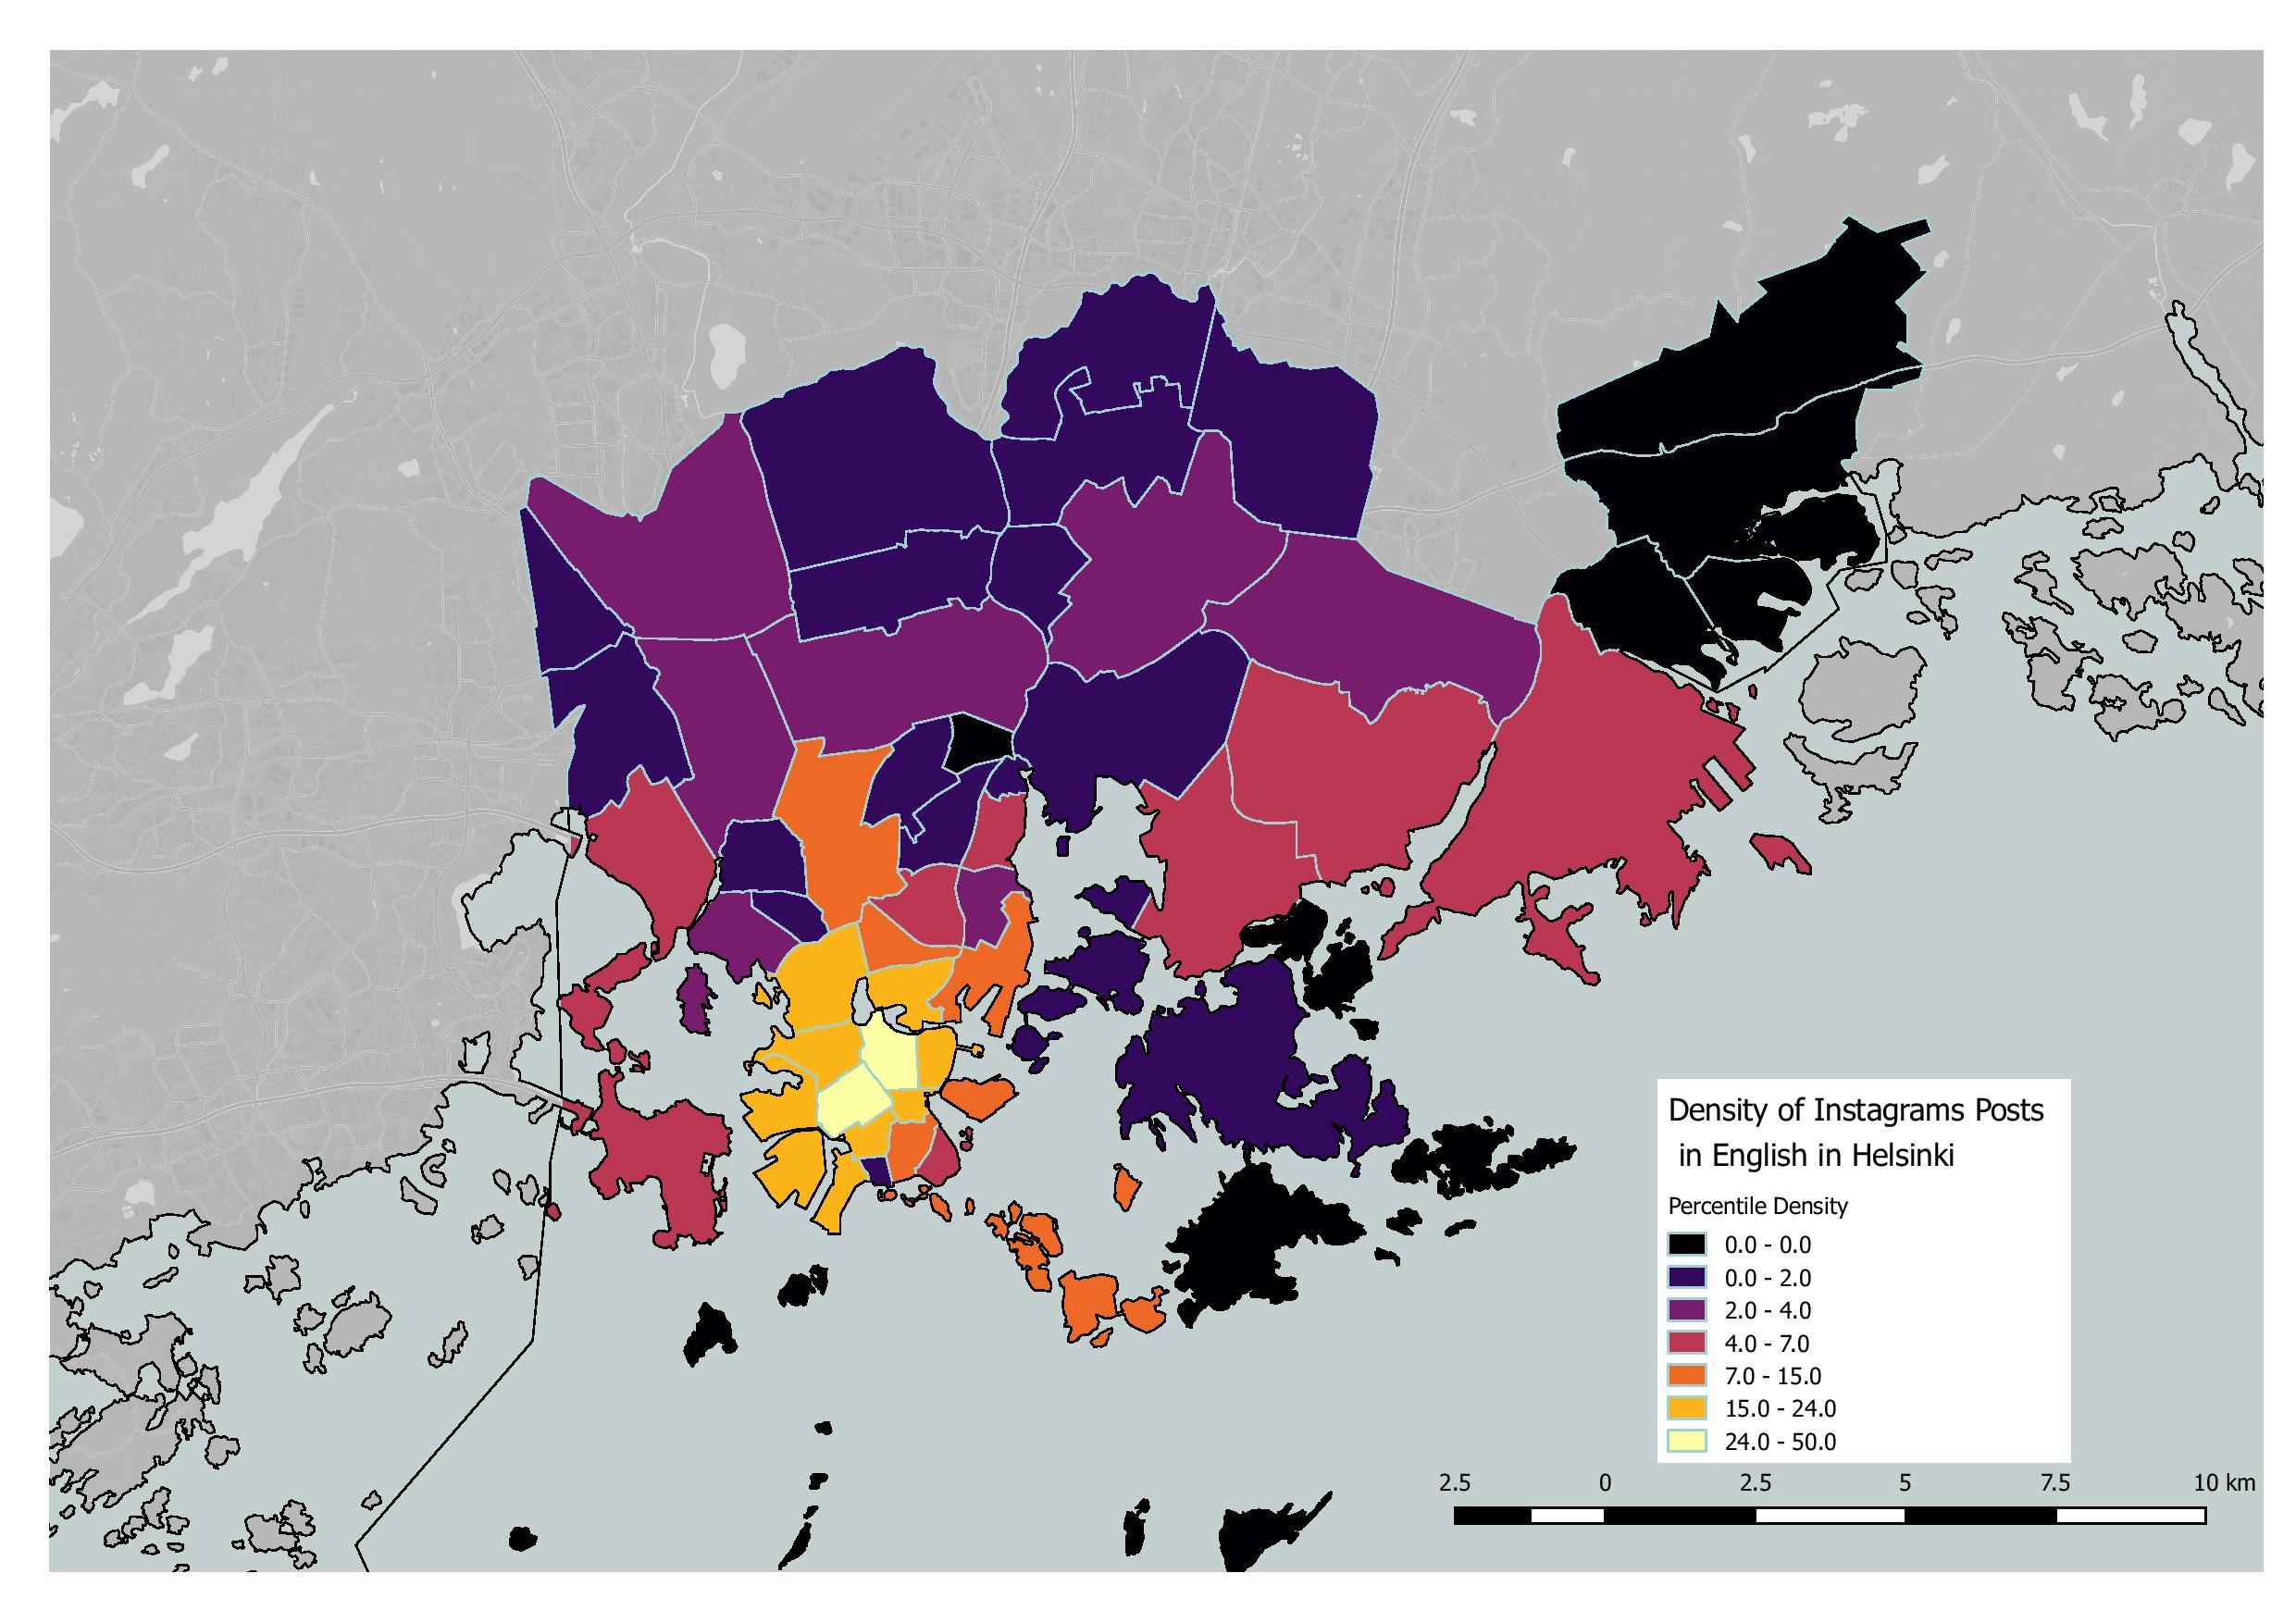
Figure 3: Percentile density of Instagram posts per subregion of Helsinki metropolitan area
Now, we wanted to see how user activities vary across different seasons. As shown in figure 4, to our surprise user activity peaks during winter and goes down in summer. Initially, we had assumed that people post more during sunny seasons and they hibernate during cold seasons.
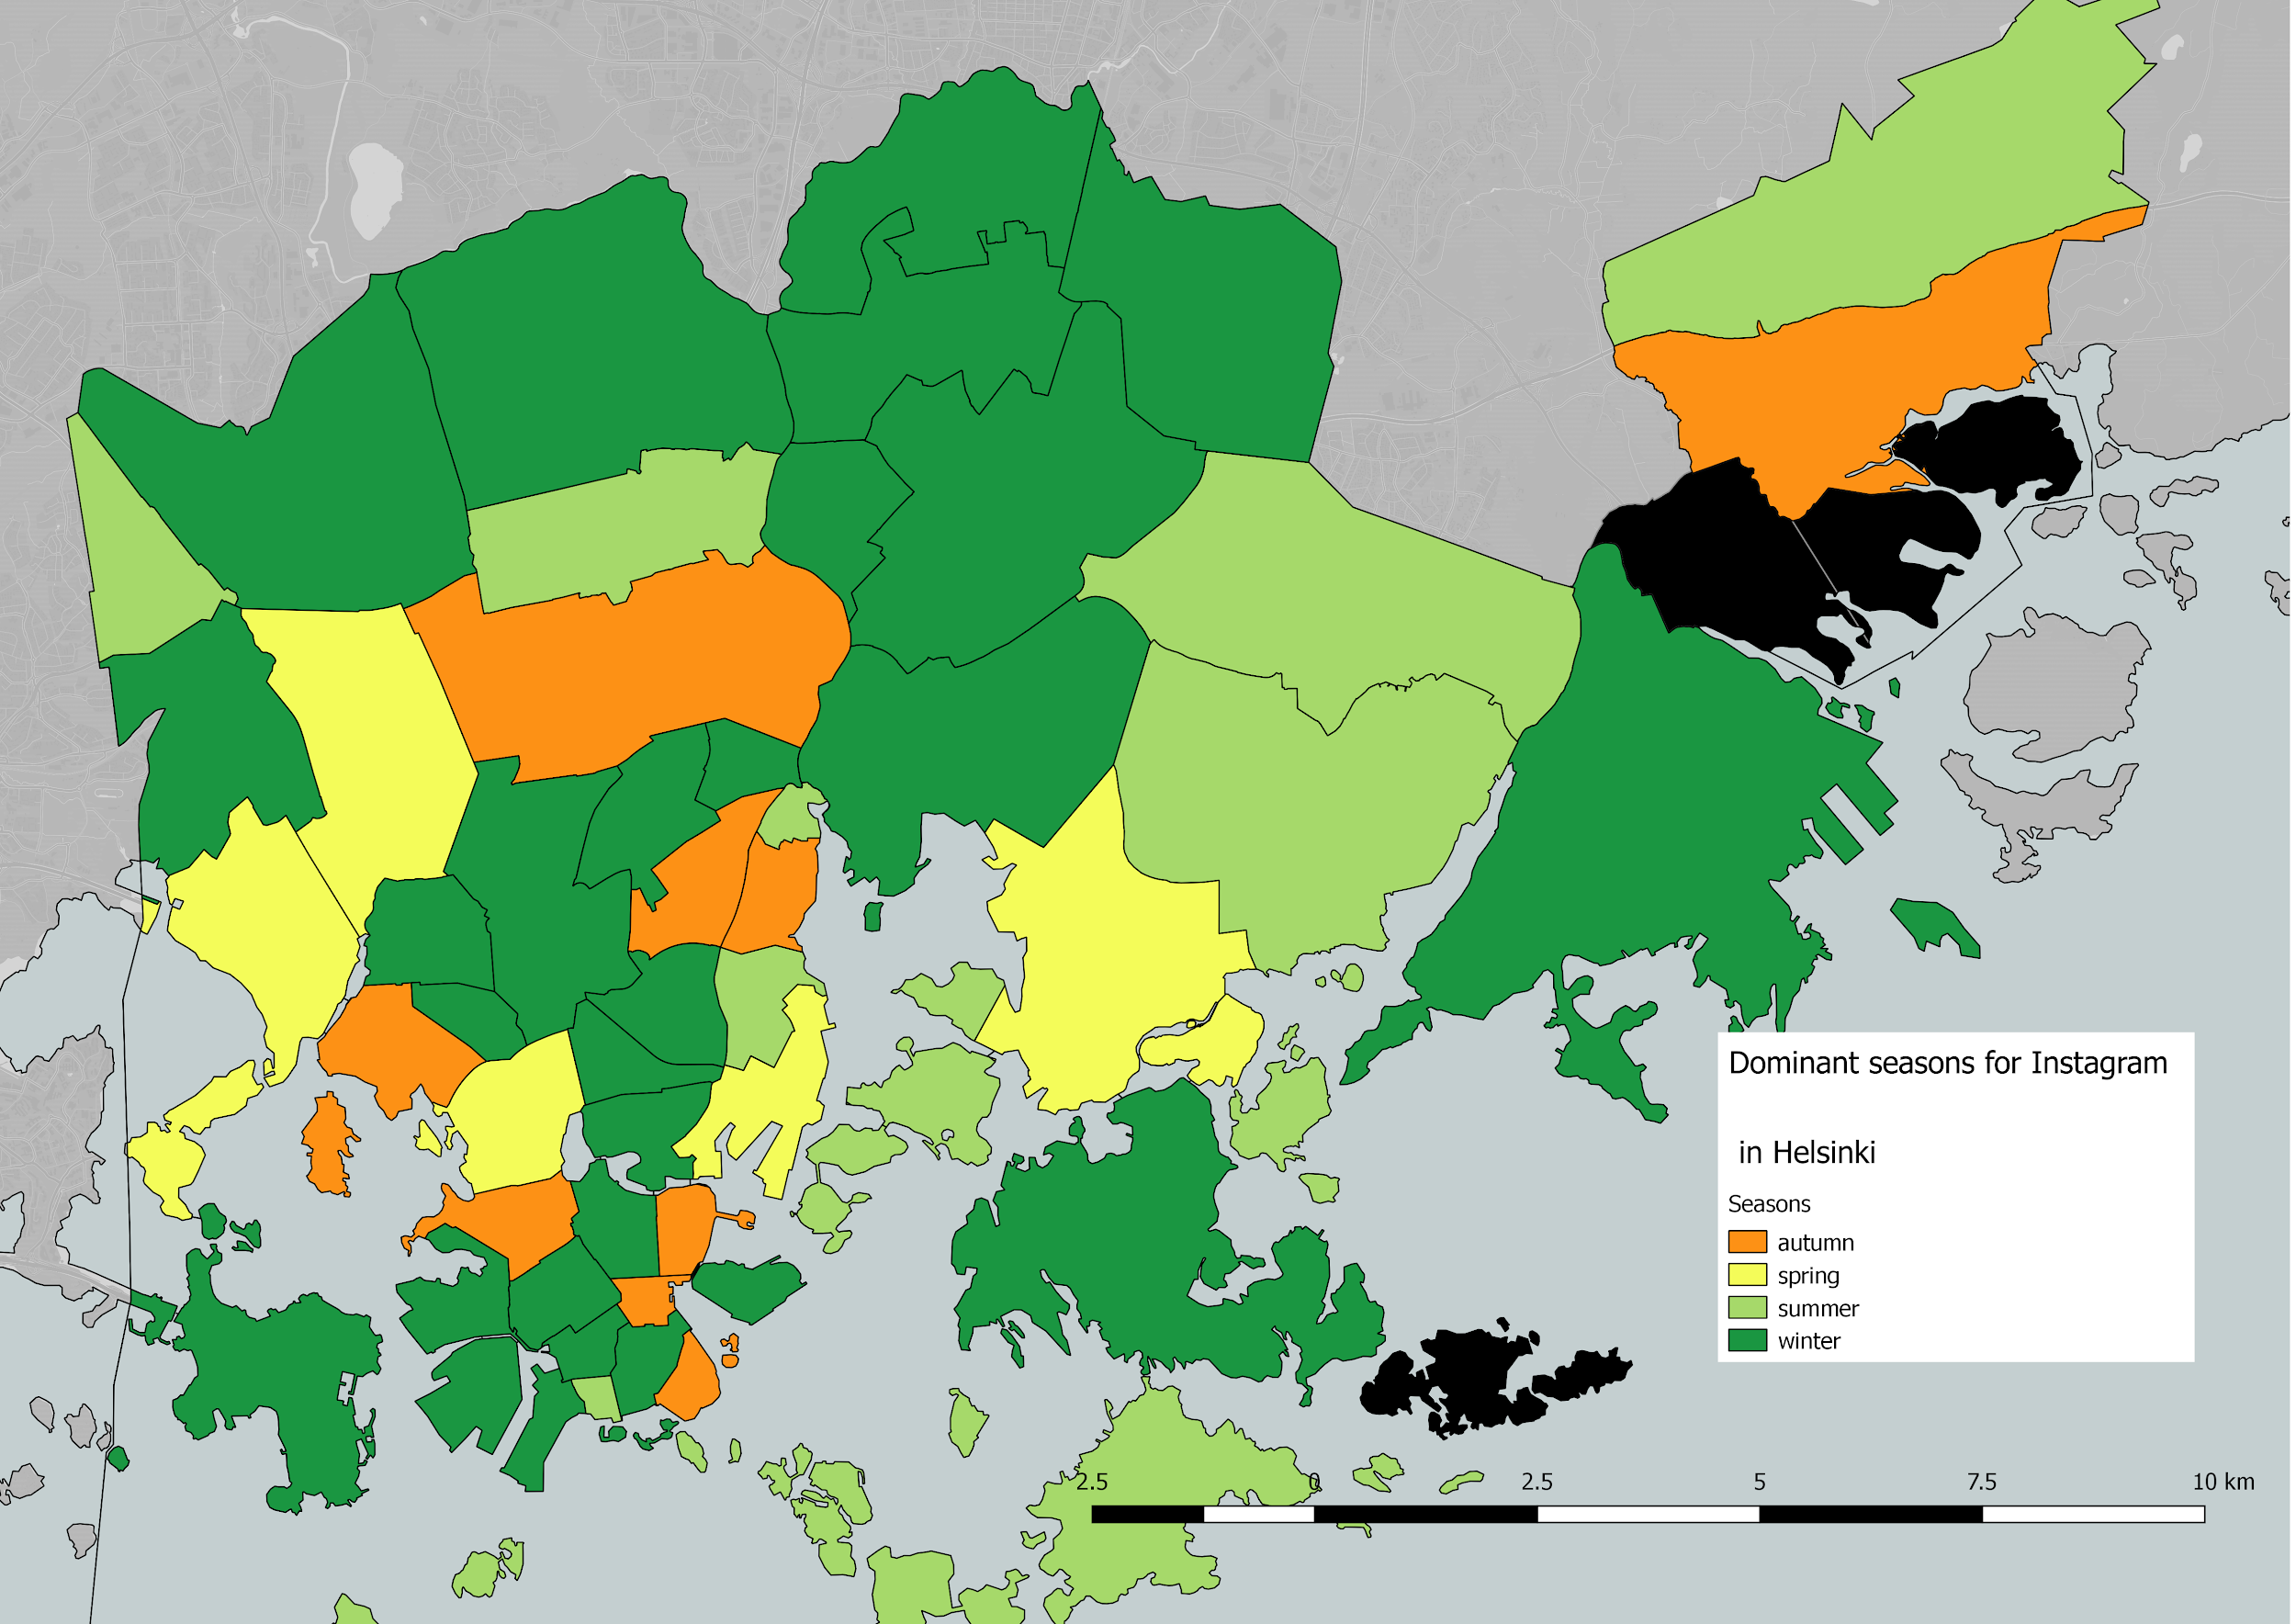
Figure 4: Instagram user activities in different seasons
To aid this result, we did a temporal analysis of sentiment polarity (Figure 5). It is evident that the positive polarity is seen during holiday season (Christmas and new year) as well as when the cold season begins i.e. the end of summer.
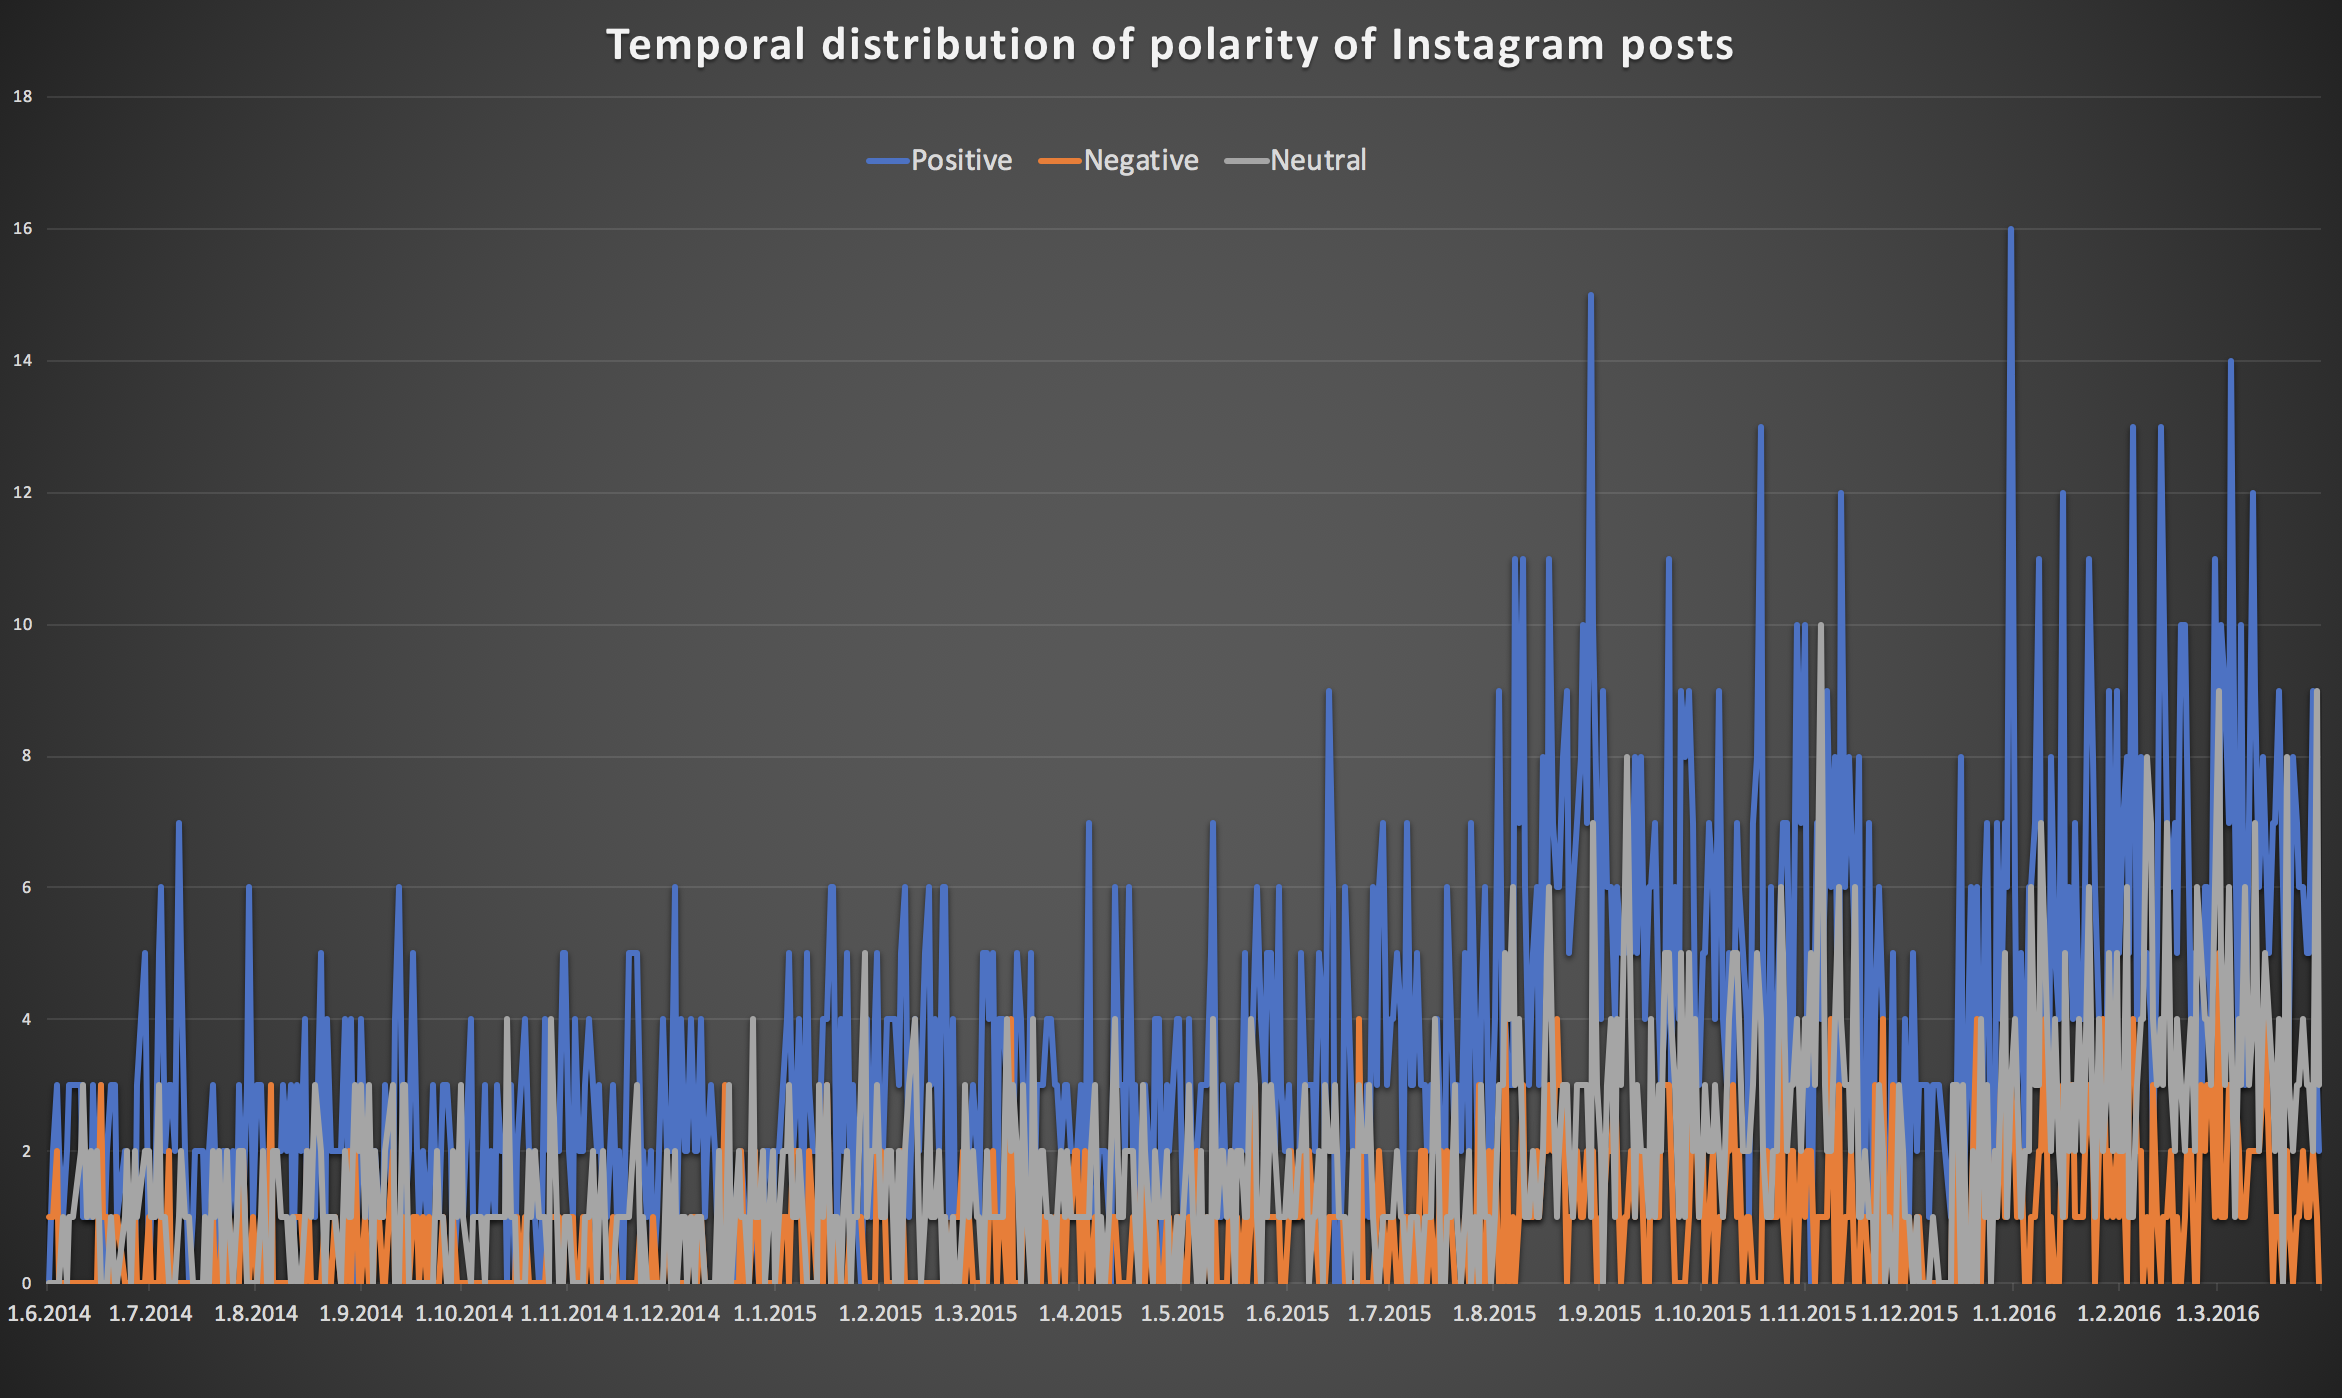
Figure 5: Temporal analysis of sentiment polarity
Last but not least, the dominant sentiments in Helsinki region as per figure 6 shows that the central touristic part of Helsinki, and some regions with parks. This is noticeable positive-sentiment skew towards the center is due to the location bias and tourist activities in that region.
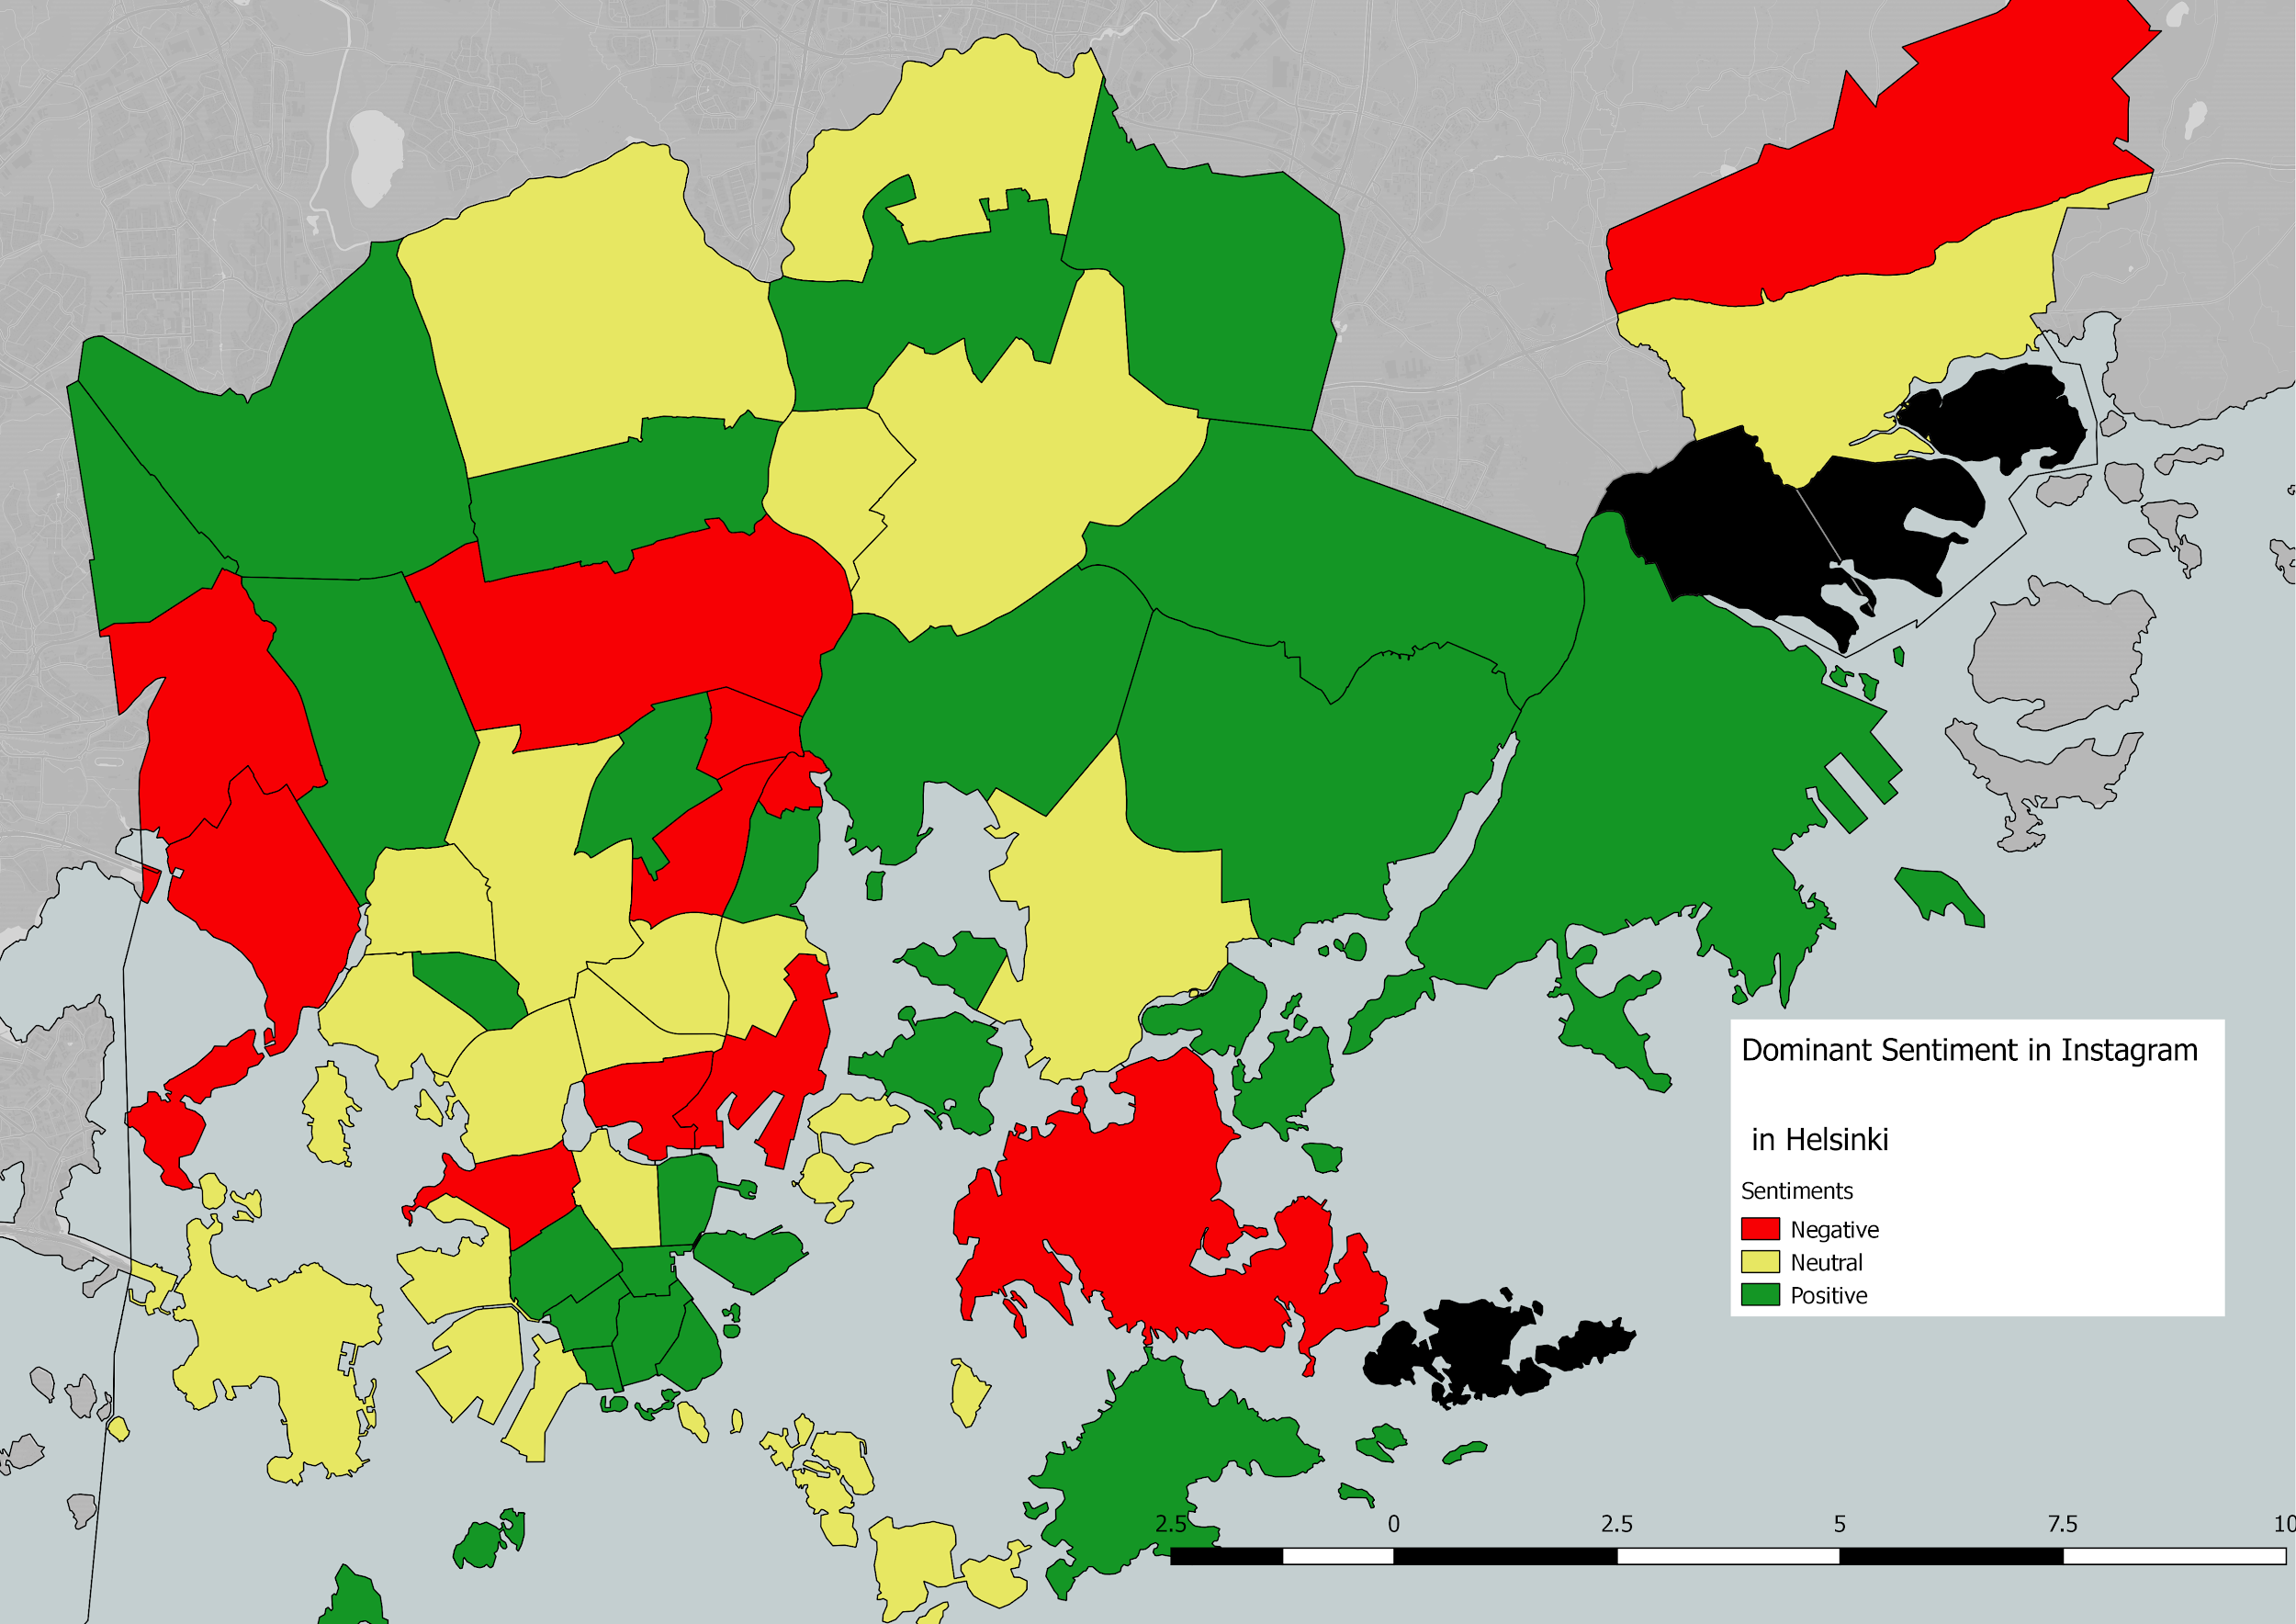
Figure 6: Dominant sentiments in the Helsinki region
Instagram APIs didn’t allow us to crawl the images of the posts, nonetheless we manually checked all the images (posts) that were tagged with negative sentiments. It looks like below:

Figure 7: Posts tagged with negative sentiments
In the first picture, a person just got over a lonely time of their life and enjoying the beginning of their new phase of life with a special friend. While the photo and contextual meaning of the text was positive, due to negative words to describe the “lonely past”, this post had received a negative sentiment score. The second picture is of a person whose bike was punctured and the pic was taken while they were walking back home with flat tyre. We didn’t notice anything positive about the post except that the person was happy to post it on Instagram. The third picture was of a happy hangover.
5. Limitations and scope for improvisation
Here are some of the limitations of our final result which we are not hesitant to admit.
- Location skew: First and foremost, the locations obtained from the Instagram posts were “Facebook’s tagged location” and not actual locations representing the exact geolocation of the posts. Hence, there could be a considerable amount of false positives with wrong locations and we have no means to verify this due to lack of location metadata from the posts.
- The positive bias: As depicted in figure 7, there is obviously a desperate attempt to show a positive image of oneself on Instagram and negative sentiment as per algorithms are not truly a representation of negative sentiments. As of now, we are not aware of doing sentiment analysis of a heavily positive-biased data other than redefining the sentiment scores within a specific range.
- Lack of normalization: The final results does not depict the real sentiment across different regions because they weren’t normalized. In other words, the
number of postswith sentiments from a specific region are not normalized. Hence, the results could be deceiving.
In terms of improvisation,
- The topic modeling failed completely due to lack of support from NLTK for Finnish names or region. Also, we tried with Latent Dirichlet Allocation (LDA) topic model of Gensim Python library. Since the geolocation accuracy was somewhat OK, we could add the coordinates as covariates for a structural topic model (STM) to see how the topics change in different parts of Helsinki. All we could do was a word cloud based on frequency which looks pretty much random.
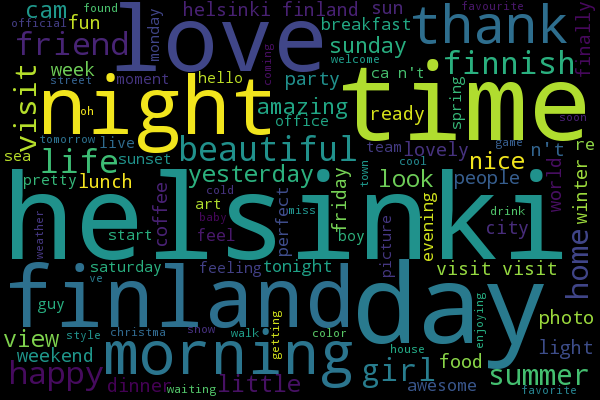
Figure 8: WordCloud based on most frequent words used in our refined dataset
- We were using different modes of communication for sentiment analysis - text, hashtags, emojis, and we used them all separately and together throughout our analysis. One thing we could have done is convert all of them to same form (say convert text and hashtags to emojis) and use this unified representation of the post for sentiment analysis.
- In fact, there is a really cool library called DeepMoji which harnesses deep learning techniques to convert any given text into an emojis-only representation.
- As me and Tuomo discussed after the hackathon, using such unification techniques to feed the results as a multi-partite input to a Convolutional Neural Networks (CNN) algorithm would increase the accuracy of sentiment analysis.
- If we have to retain the text, emojis and hashtags as it is, coming up with a weighted algorithm to weigh each of them on some criteria to have an impact on final sentiment score is the way to extend further. Also, normalizing them over location, by giving a weight to location as well would potentially be an improvisation of what we did during the hackathon.
Speaking of difficulties we faced (other than what has been already described in this post):
- Not being able to access the actual images from the Instagram posts was a big bummer. Thanks to Cambridge Analytica and its previous predators, most of the social media APIs have drastically changed over the last two years and it hinders what we can do in terms of research and learning without any commercial interest.
- Since we had the URLs of the posts, writing a crawler (e.g. using requests and beautiful soup, or scrapy) to extract the images was the obvious option. However, based on my previous experience I was aware that at some point Instagram would block all my requests.
- If we had the images, our plan was to use Detectron,a state-of-the-art object detection module, to detect the objects in each of the photos and use them with sentiment analysis scores to see “what things make people happy”. At worst case, we could have at least analyzed the dominant colors in the photo to see whether green (trees, forest, park) and blue (water and sky) have any affinity towards the sentiment score. Unfortunately, we could not perform any of these.
- Though Aylien provided us with a API key, we could not perform a batch analysis beyond the restricted limit. Due to the limit, we could only do a small set of queries to Aylien at a time and redoing all over analysis with any minimal modification was hence more time consuming.
- Though Elias helped us a lot with QGIS and Firaz quickly picked it up, we lacked a dedicated GIS expert in our team. We initially had one such person allocated to our, but unfortunately he could not participate.
6. Deliverables
Over the period of these 8 days of hackathon, we had learned many new things, made good networking with peers from diverse fields of study, had enough free food/coffee/wine, etc. Besides that, we had:
- given three presentations (initial, midway and final),
- presented a colorful poster
- created a code repository on Github.
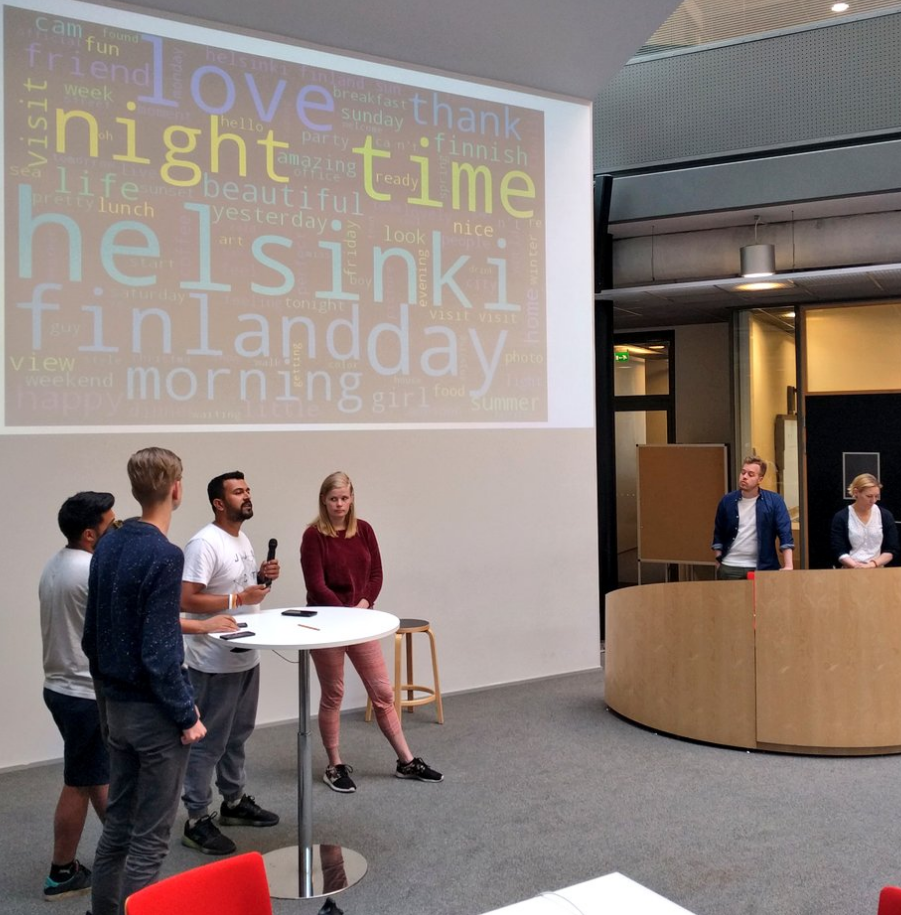
To summarize, #DHH18 was amazing! Since this event happens every year, I personally would recommend this to every student in Helsinki who is interested to learn human aspects of computer science.
